The Greek Tragedy
6. Loss of Competitiveness and Four Options for Greece
As was the case in the other euro countries afflicted by the crisis, the crisis in Greece arose from a credit bubble caused by the euro. As shown in Figure 6, Greek interest rates fell from 25% in 1992 to 5% in 2001, the year that Greece joined the euro. And as explained in Box 2, this was due to the fact that investors no longer saw any devaluation risk and that they were induced by flawed regulatory systems to neglect the insolvency risk. The credit that flowed into the Greek economy triggered massive wage increases, but since these wage increases exceeded the economy’s productivity growth, goods prices rose. This, in turn, destroyed the competitiveness of the Greek economy, which wasn’t in great shape even before joining the euro.
A country's competitiveness depends partly on its productivity, as determined by local conditions like infrastructure, geographical location, education level of its population and the quality of its institutions. It also partly depends on factor costs, i.e. the cost of capital, land and labour. Even the most unproductive country on earth can be competitive if its factor costs are sufficiently low. Since capital costs are defined by the international capital market and land prices are mainly determined endogenously by other conditions, labour costs, which are often determined politically rather than by competition, tend to be the key. If they are too high compared to other factors, the country is too expensive. It will have chronic foreign trade deficits and foreign direct investors will steer clear of it. The resulting financing gaps have to be filled by loans from foreign private investors or foreign state institutions (including other central banks).
Figure 9 shows the evolution of the price level of goods produced in Greece (GDP deflator), which is the result of productivity and factor costs, relative to the rest of the Eurozone. The relative price index featured is standardised so that it reaches 100 at the time of the Lehman crisis. The figure shows that the Greek price level before the crisis rose faster than in other countries, with a real appreciation of 16% from the beginning of 1995 to the time of the Lehman-crisis. It was as if Greece still had the drachma and it had appreciated by 16%.
The relative price index shown also includes the open devaluations of the drachma that took place during the period prior to accession, and especially in the years 1995 and 1998. Without exchange rate fluctuations the real appreciation would have been 31%. However, exchange rate fluctuations are as relevant to competitiveness as price changes in the narrower sense of the term.
It is remarkable that Greece's relative price level only peaked in 2009, well after the crisis had broken out, because the government raised the wages of state employees, as described in Section 3, very sharply in 2008 and 2009. From the beginning of 1995 to the end of 2009, Greece effectively appreciated by 18%.
The relative price level did not fall noticeably until 2012, when the international community started to get serious about budget cuts after the massive haircut applied to Greek debt. The decline in relative prices from the time of the Lehman crisis to the present (4th quarter of 2014) amounts to 8% (9% from the peak reached in the 4th quarter of 2009).
Figure 9: Price level of goods produced in Greece in relation to the rest of the Eurozone (index values)
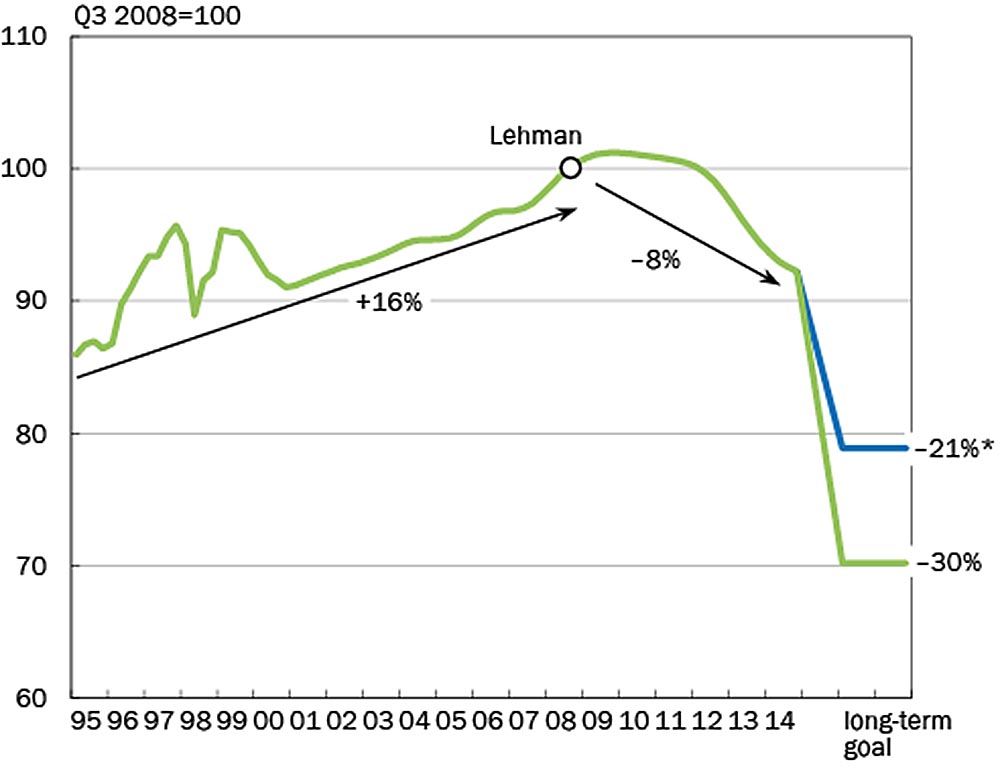
* Revised calculation after the spring 2012 haircut.
Sources: European Commission, Economic and Financial Affairs, Economic Databases and Indicators, Price and Cost Competitiveness, Quarterly Real Effective Exchange Rates Compared to the (Rest of) Euro Area, Price Deflator GDP, Market Prices; L. H. W. Nielsen, Goldman Sachs Global Economics, "Achieving Fiscal and External Balance (Part 1): The Price Adjustment Required for External Sustainability", European Economics Analyst, Issue No. 12/01, 15 March 2012; and in the same publication, "External Rebalancing: Progress, but a Sizeable Challenge Remains", European Economics Analyst, Issue No. 13/03, 17 January 2013.
Note: The chart shows the original values of the real effective exchange rates, as published by the European Commission. These figures basically measure the relation of the price level of domestically produced goods (GDP deflator) relative to the trade-weighted average of the price level of Eurozone trade partners, whereby open exchange rate fluctuations before the introduction of the euro are included. The last data point in the chart corresponds to the 4th quarter of 2014.
It must be borne in mind that the chart says nothing about the absolute level of Greek prices, but only about how this level changed relative to that of other countries. Absolute price index comparisons are difficult due to the different bundles of goods that are included in calculating the price indices. Furthermore, only the prices of the other euro countries are used for the purposes of comparison, for the euro prices of non-euro countries are co-determined by the exchange rate with the euro. Since the exchange rate is freely determined on the markets, the Eurozone as a whole can hardly be said to have a chronic competitiveness problem. It is implicitly assumed in the following discussion that the euro exchange rate in the aggregate is determined in a way that preserves competitiveness.
Moreover, it is important to note that the price level of the GDP deflator covers the goods produced by the country itself, and not the prices of consumer goods, for the latter include many imports, especially in the case of Greece, that should not be included in the assessment of a country's competitiveness.
Sometimes unit labour costs are used as a basis for comparisons instead of the price level. Although that may seem straightforward because it establishes a relation between hourly wage costs and productivity, in an economy affected by mass unemployment the productivity of those jobs remaining in the statistics is often high, because the less productive jobs have already been rationalised away, or because less productive companies have gone bankrupt. A comparison based on unit labour costs only makes sense if the layoff effect on productivity is subtracted out, which is a difficult undertaking.
In addition to actual developments in relative prices, Figure 9 also shows alternative estimates of the price adjustment required in Greece over a period of twenty years. These adjustments were calculated by the economics department of Goldman Sachs at different points of time and for different levels of debt, and are converted here so that they are comparable with the Eurostat data depicted in the curve. According to the Goldman Sachs calculations, Greece needs to depreciate by around 20% to 30% compared to the time of the Lehman crisis in order to restore its competitiveness and achieve long-term debt sustainability for the overall economy (and not just the government).1 Figure 9 shows that Greece is on the right path thanks to the price restraint or disinflation exercised since 2012. However, by the end of 2014 it had only managed 8 percentage points along this path.
Basically there are only four responses, all ultimately unpleasant, to the country’s lack of competitiveness. Three of these represent different ways of achieving the relative price adjustments, while the first one involves abandoning them.
(1) If the other countries accept Greece's lack of competitiveness, they must be prepared to continue to support it financially. This is the path towards a transfer union. In such a scenario, living standards in Greece would be maintained thanks to ever-rising amounts of public loans from the international community, while credit granted via the extension of maturity and lowering of interest rates to almost zero would gradually turn such loans into pure transfers. This path is not really attractive, even for Greece, because it infects the country with the Dutch Disease already discussed in Section 2.
(2) Greece could be forced to deflate. However, the magnitude of deflation needed would lead to mass bankruptcies because Greek debtors would no longer be in a position to service their debts. After all, it was a credit bubble that brought Greece into its unenviable situation. Unlike the Baltic countries, which pulled off a real devaluation, households, companies and the government in Greece are up to their ears in debt. There would also be major problems with tenants who are bound by long-term contracts. Moreover, such a policy would also encounter fierce resistance from the unions due to the necessary wage reductions.
The problems created by this option would be similar to those experienced by Germany during the global economic crisis of the 1920s and early 1930s. While England left the gold standard in 1931 and depreciated, Germany was bound to it by the Dawes and Young plans, which demanded reparation payments in non-devalued Reichsmarks, forcing Germany to realise an internal devaluation through Chancellor Brüning’s austerity policy. German prices accordingly fell by 23% 2 from 1929 to 1933, while wages fell by as much as 27%. 3 There was, unfortunately, no alternative, as economic historian Knut Borchardt emphasises. 4 The austerity policy drove the country to the brink of civil war; what came in 1933 was even worse.
(3) The northern European countries could inflate. With its zero-interest policy and its policy of quantitative easing (QE) in particular, the ECB is currently trying to stoke inflation towards its goal of 2% per year for the Eurozone average. The smart thing to do for the southern European countries is to opt for a moderate austerity policy so as to avoid this inflation. If they do so and Germany inflates fairly quickly, by an annual rate of 4% for ten years, while the crisis countries including Greece (but without Ireland) remained at zero percent and France inflated at 1% and the other euro countries at an average of 2%, the necessary adjustment in relative goods prices would be largely achieved in ten years. It is impossible to predict whether the populations of the crisis-afflicted countries would be tolerant enough to accept such a ten-year period of stagnation, and whether Germany, conversely, would accept a 50% increase in its price level over that period.
(4) Greece can leave the European Monetary Union, return to the drachma and then devalue it. Although this path would be fast, there would be the danger of bank runs and massive capital flight, as seen in Cyprus in 2012 and 2013. Capital controls would have to be imposed, like in Cyprus, to limit transfers of cash abroad and the emptying of bank accounts.
None of these alternatives is really attractive, but since there are no other options available, politicians will have to make their choice.
Continue to Section 7: Advantages and Disadvantages of a Grexit
Footnotes
1 The target for the devaluation required and the resulting improvement in the balance of trade is defined such that the net external debt will fall below 25% of GDP over a period of 20 years. A first calculation showed a necessary price reduction of around 30% vis-à-vis the 3rd quarter of 2010. See L. H. W. Nielsen, Goldman Sachs Global Economics, "Achieving Fiscal and External Balance (Part 1): The Price Adjustment Required for External Sustainability", European Economics Analyst, Issue No. 12/01, 15 March 2012. After the interest-lowering bail-out measures and the haircut of 2012, the calculation was updated, resulting in a price reduction of around 15% to 25% vis-à-vis the 3rd quarter of 2012. See L. H. W. Nielsen, Goldman Sachs Global Economics, "External Rebalancing: Progress, but a Sizeable Challenge Remains", European Economics Analyst, Issue No. 13/03, 17 January 2013. The chart above uses the updated calculation of the average value of 20% for the necessary price adjustment vis-à-vis the 3rd quarter of 2012. Since Greece's relative price level had already fallen by around 1% between the 3rd quarter of 2008 and the 3rd quarter of 2012, this means that a price adjustment of 21% would be necessary compared to the 3rd quarter of 2008.
2 See Federal Statistics Office, Fachserie 17, prices, series 7, p. 2.
3 See J. H. Müller, Nivellierung und Differenzierung der Arbeitseinkommen in Deutschland seit 1925, Duncker & Humblot, Berlin 1954.
4 K. Borchardt, "Zwangslagen und Handlungsspielräume in der großen Wirtschaftskrise der frühen dreißiger Jahre: Zur Revision des überlieferten Geschichtsbildes", celebratory address given on 2 December 1978, Jahrbuch der Bayerischen Akademie der Wissenschaften, Beck, Munich 1979, p. 85–132.