
Austerity
Since the sovereign debt crisis erupted in the euro area, there has been much discussion about the costs and benefits of fiscal adjustment, or austerity.1 While several euro area countries have experienced a rapid rise in their public debt, calling for a reduction in government deficits, the crisis has also plunged them into a deep recession. This, in turn, has limited their scope for reducing public deficits, and may even have required short-term deficit increases in some cases. However, the costs and benefits of fiscal policy depend heavily on the nature of the recession. If a recession is caused by a temporary demand shock, fiscal expansion can effectively offset its effect in terms of output and employment. If, however, it is caused by a permanent demand or supply shock, the benefits of fiscal expansion are far more limited. We argue that the shock that triggered the Great Recession was more permanent, limiting the potential benefits of any fiscal expansion.
The fiscal expansion of 2008 and 2009
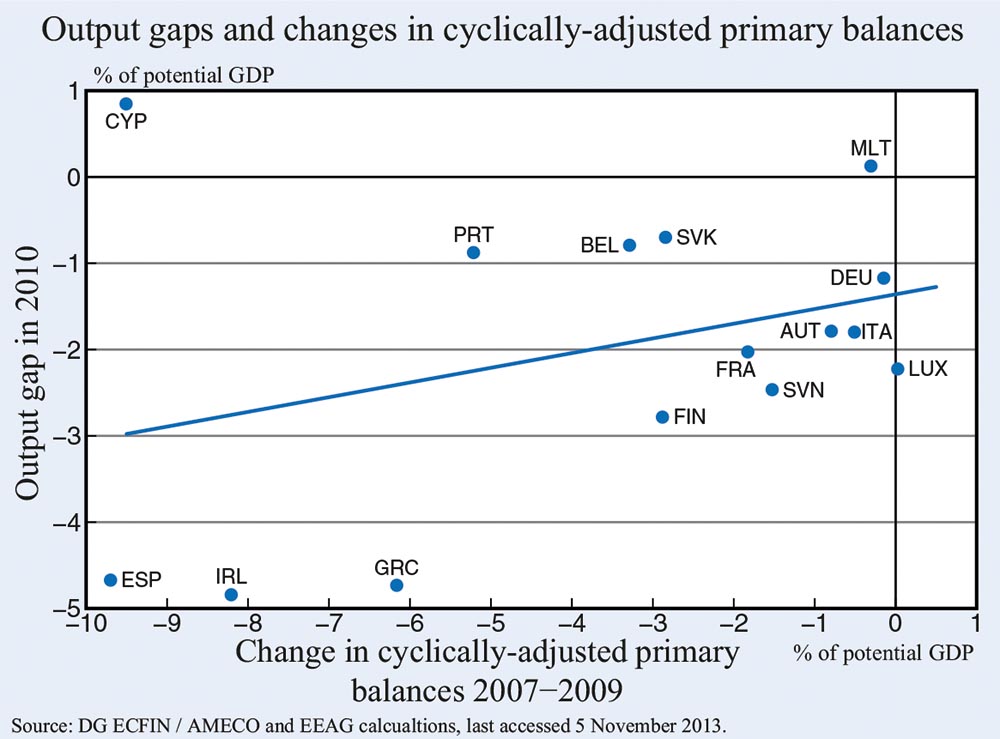
When the financial crisis hit, governments in the euro area interpreted it as a temporary demand shock, and reacted with a fiscal expansion. The size of the expansion measured by the cyclically-adjusted primary balance of the government varied across countries. It declined relative little in the core, but to a far greater extent in the periphery countries, as shown in Figure 1. However, fiscal expansion was not particularly effective in off-setting the recessionary effect of the crisis. Greece, Ireland, and Spain engaged in a fiscal expansion of over 6% of potential GDP between 2007 and 2009, and these countries still experienced a negative output gap of over 6% in 2010. The fiscal expansion in the periphery produced hardly more than rapidly accumulating public debt levels, setting the stage for the subsequent European sovereign crisis. In our opinion, the ineffectiveness of the fiscal expansion resulted from the fact that the shock was more permanent.
Figure 1:
Fiscal retrenchment between 2009 and 2012 – austerity
The sovereign crisis forced the hand of the euro area periphery countries. Ireland, Portugal and Greece had to pay substantially higher interest rates in the bond markets. The markets were effectively forcing these countries to frontload their fiscal adjustment. As this is very costly in terms of employment and output, the governments of the periphery decided to seek external assistance from the community of states, as represented by the Troika (ECB, IMF and European Commission). This enabled them to backload the fiscal adjustment.2 That is, the assistance, which required highly criticised austerity measures, actually reduced the cost of fiscal adjustment relative to the cost that the markets would have imposed on these countries.
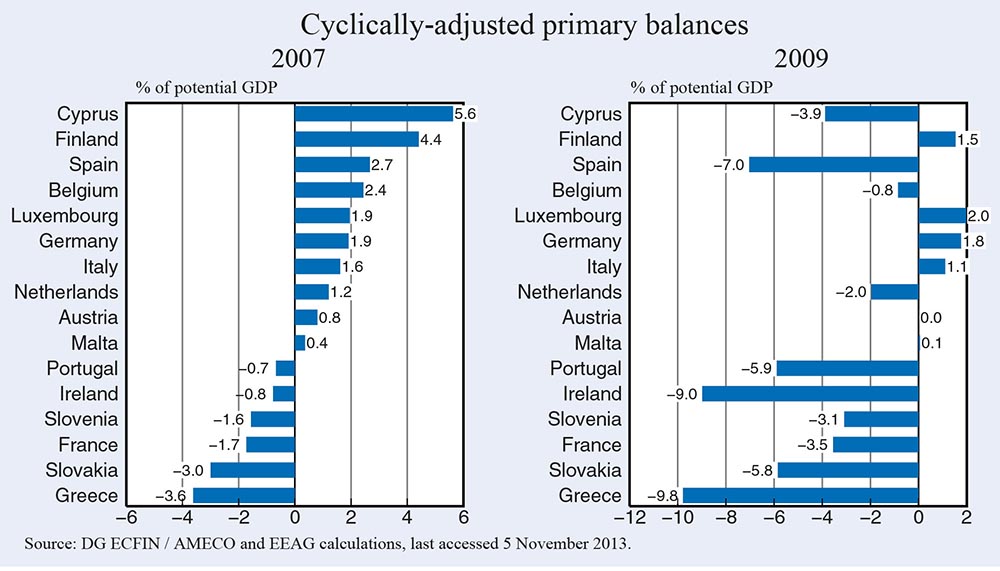
Figure 2 shows the cyclically-adjusted primary balances relative to potential output in 2007, 2009 and 2012. Firstly, comparing the three periods, we can see that with the exception of Finland and Luxembourg, all of the euro area countries implemented austerity measures. As many observers have noted, Greece implemented a very large adjustment, which deserves applause, as do the efforts of Ireland and Portugal. However, these austerity efforts have to be seen in context, given that the very same countries carried out fiscal expansion in the preceding two years. The Spanish and Irish austerity measures, in particular, did not even reverse the previous expansion, while Portugal’s austerity measures were about the same size as the fiscal expansion implemented during the two years previously. Over the five years period, Greece was the only country to implement significant austerity measures.
Figure 2:
Effects of austerity
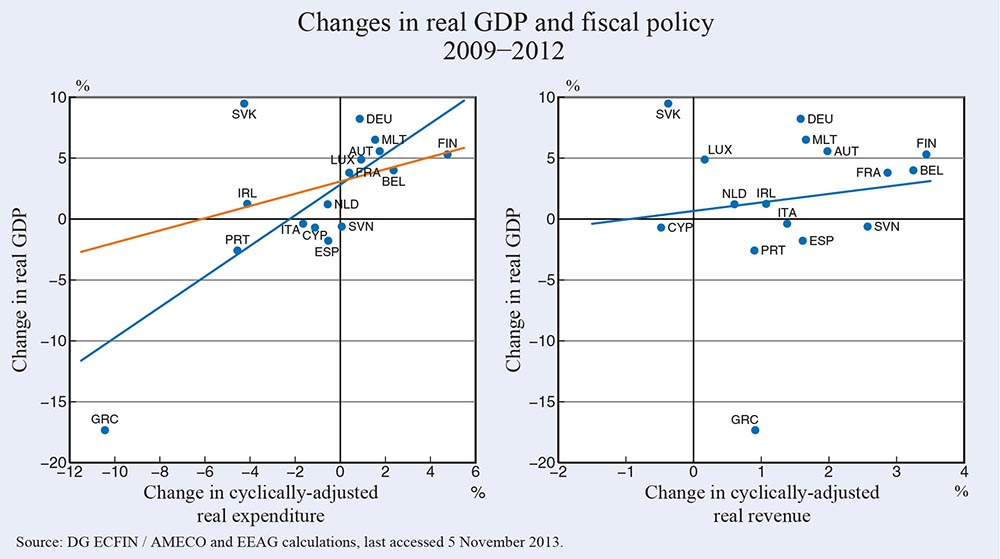
We turn now to the effect of austerity on the economy. Figure 3 plots the change in real GDP between 2009 and 2012 against the change in cyclically-adjusted non-interest expenditures and revenues of the government, respectively. The left-hand side of the figure is consistent with the standard effect of austerity: Expenditure changes are positively correlated with output. However, the strong negative relationship of expenditure cuts with output is again primarily driven by Greece. Without Greece the relationship still appears to be negative, but is much more muted, as shown by the red line in the diagram. The right-hand side of the figure is less conclusive. If anything it suggests that revenue changes are also positively correlated with output, which would be the opposite of the standard austerity effect.
Figure 3:
The loss of output over these four years was relatively modest, except for Greece. Hence it is rather puzzling why the impression arose that the periphery of the euro area had been plunged into a deep recession. The answer is provided by Figure 4, which plots changes in real GDP against changes in employment. Here we can see dramatic changes both between Q3 of 2007 and Q3 of 2009, and between Q3 of 2009 and Q3 of 2012. Over these two periods employment fell by over 15% in Greece, by about 15% in Spain and Ireland, and by around 10% in Portugal.
Figure 4:
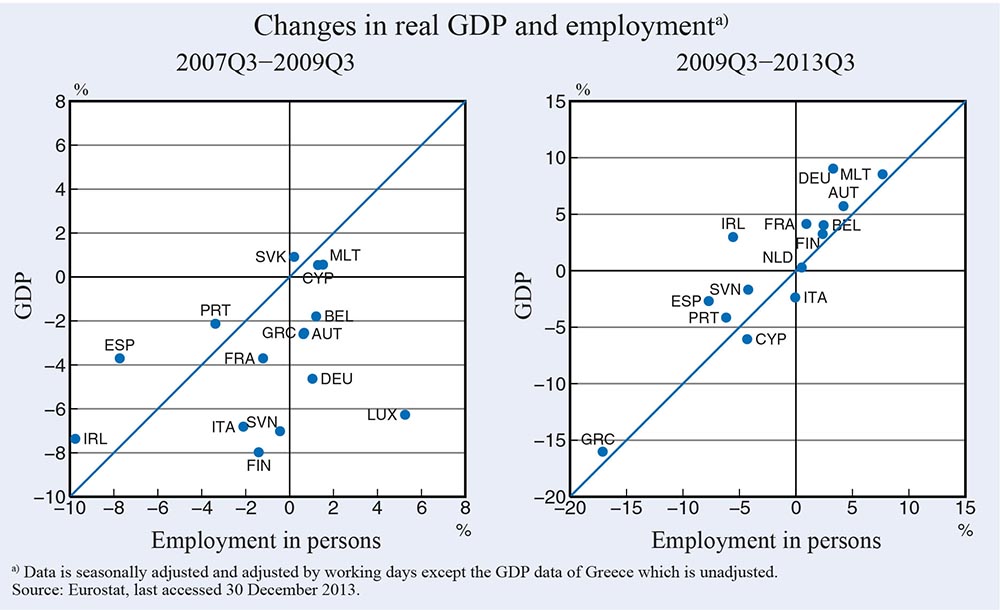
Moreover, the figure also reveals another difference between the euro area core and periphery. The change in output was larger than the change in employment in the core countries both between Q3 of 2007 and Q3 of 2009 when output fell, and between Q3 of 2009 and Q3 of 2012 when output rose. By contrast, the change in output was smaller than the change in employment in the periphery countries during both periods with the exception of Greece, where employment only changed more than output between Q3 of 2009 and Q3 of 2012. In other words, labour productivity appears to be pro-cyclical in the core countries, but counter-cyclical in the periphery during this recession. The fact that labour productivity has risen in the periphery may suggest that firms realised early on that they faced a more persistent demand and/or supply shock and laid off workers even faster than their output fell as a result.
Adjustment and austerity
Reasons why firms in the periphery thought that they face more permanent shocks, can be gauged from Figure 5. This shows the changes in employment between Q3 of 2007 and Q3 of 2009 and between Q3 of 2009 and Q3 of 2013 across six major industries of the economy. Firstly, the fall in employment in both periods occurred primarily in goods production, in construction, and in trade and transport. About half of the overall employment loss in Spain and Ireland, about one third in Portugal and about one fifth in Greece occurred in the construction sector. Secondly, the rise in employment in both periods occurred in the service industries, excluding trade and transport. More specifically, the rise in employment in some industries occurred at the same time as the fall in employment in others.
Figure 5:
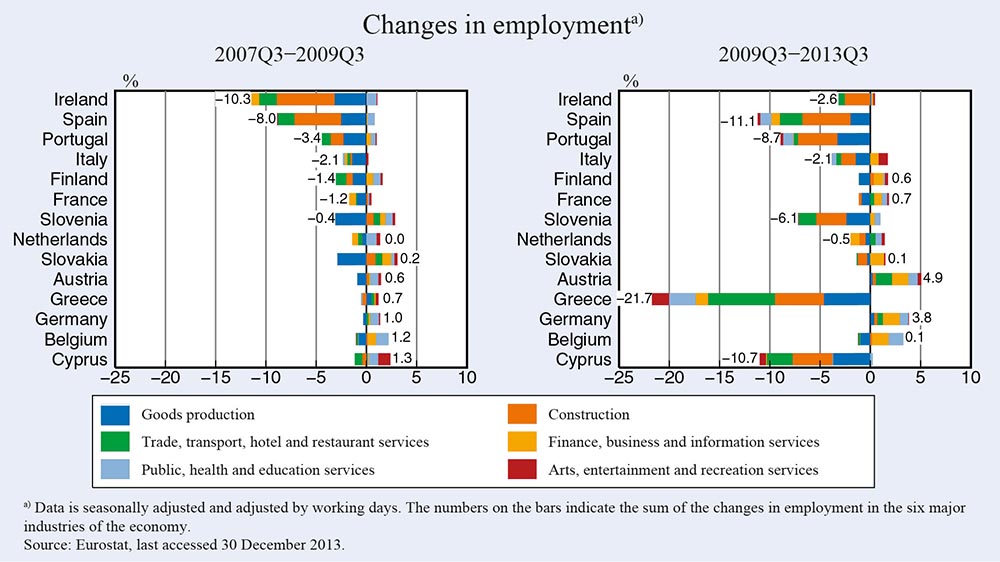
One interpretation of these facts is that the investment boom in the periphery was accompanied by a massive misallocation of capital and labour across sectors. Once the crisis hit, many firms realised that the previous employment levels in their industries were not sustainable, and employment levels in their particular industries would be permanently lower. This induced a massive reallocation of labour (and capital) across industries in the periphery countries. For workers, changing industries is costly, and usually takes a long time, hence employment levels are likely to recover only gradually and over time. This process may take a long time in countries with rigid labour markets.
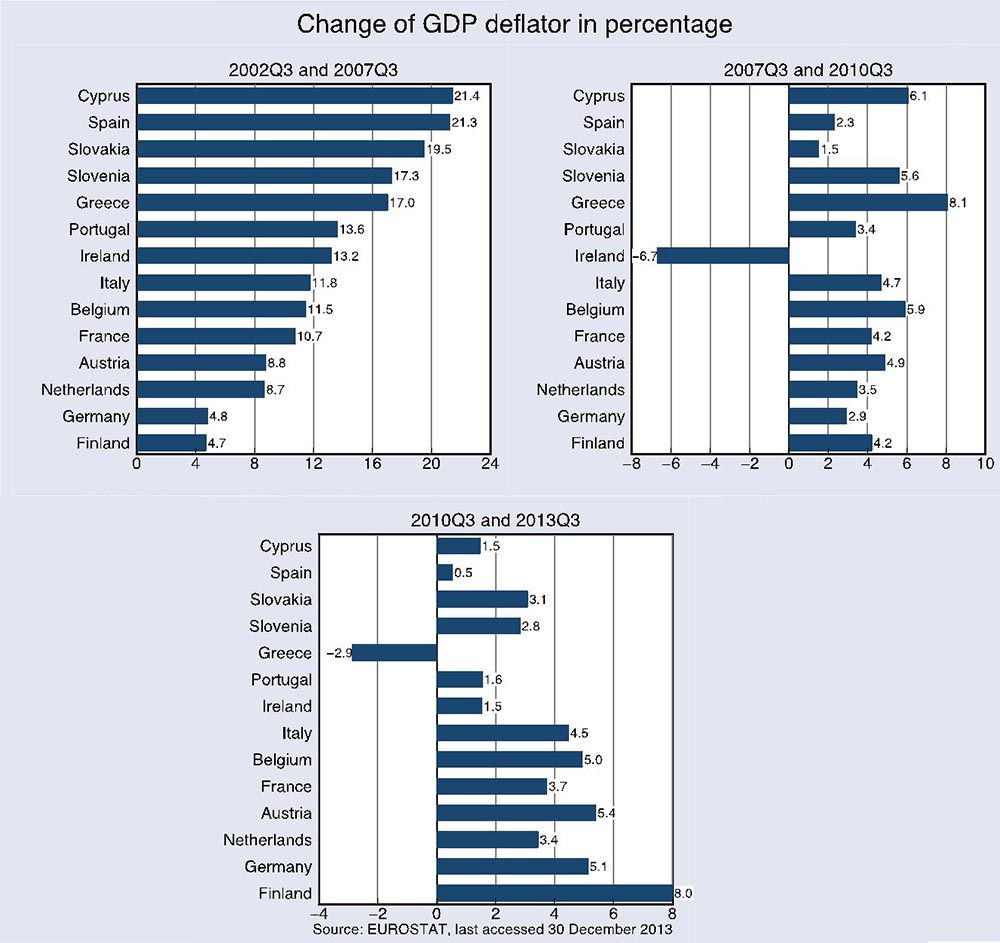
During the boom years prior to the crisis, the periphery countries experienced exuberant investment activity and private capital inflow, but lost their competitiveness due to excessive increases in goods prices relative to the rest of the euro area, accumulated large current account deficits, and suffered the misallocation of their productive resources. Austerity contributes to the slow process of improving the competitiveness of the periphery countries as it reduces aggregate demand, and hence helps to realign the relative price levels. Figure 6 shows that after a strong real appreciation between 2002 and 2007, there was little realignment between 2008 and 2009 in the periphery countries.3 The price level in all periphery countries only grew more slowly than in the core during the period of fiscal austerity.
Figure 6:
Conclusion
The euro area periphery has been in recession since 2008, and austerity is increasingly blamed for economic sluggishness. Although austerity undoubtedly contributed to the recession, the latter was also driven by combination of a more permanent negative demand shock and a negative supply shock. The negative demand shock in the periphery was more permanent than in a normal recession because households in the periphery downwardly revised their expectations regarding the speed of convergence with the euro area core. A more permanent supply shock originated from the pre-crisis misallocation of production factors, particularly labour. The adjustment towards labour allocation and relative prices that are consistent with smaller external balances is accompanied by a recession. This adjustment process may take a long time as in most cases of large-scale labour reallocation. How much austerity was really needed, or what combination of austerity and debt forgiveness was and is required, are issues that remain open to debate. However, it is clear that austerity is a pre-requisite of the necessary rebalancing of relative prices in the euro area, which was distorted in the credit bubble caused by the introduction of the euro.
Akos Valentinyi and Hans-Werner Sinn
This column is based on EEAG (2014), The EEAG Report on the European Economy, “Austerity: Hurting but Helping,” CESifo, Munich 2014, pp. 75-90 (http://www.cesifo.org/eeag). The EEAG members are Akos Valentinyi (Cardiff Business School, Chairman), Giuseppe Bertola (EDHEC Business School), John Driffill (Birkbeck College), Harold James (Princeton University), Hans-Werner Sinn (Ifo Institute and LMU University of Munich) and Jan-Egbert Sturm (KOF Swiss Economic Institute, ETH Zurich). They are collectively responsible for each chapter in the report. They participate on a personal basis and do not necessarily represent the views of the organisations they are affiliated with.
References
Alesina, A., C. Favero and F. Giavazzi (2012), “The Output Effect of Fiscal Consolidations,” NBER Working Paper No. 18336.
EEAG (2013), The EEAG Report on the European Economy, CESifo, Munich 2013.
EEAG (2014), The EEAG Report on the European Economy, “Austerity: Hurting but Helping,” CESifo, Munich 2014, pp. 75–90.
Jordà, Ò. and A. M. Taylor (2013), “The Time for Austerity: Estimating the Average Treatment Effect of Fiscal Policy,” NBER Working Paper No. 19414.
1 See Alesina et al. (2012) and Jordà and Taylor (2013) among others.
2 Greece received its first bailout in May 2010, and its second bailout in February 2012. Ireland, Portugal and Cyprus received bailouts in November 2010, May 2011 and in March 2013 respectively. The Spanish government received a bailout package in June 2012 to rescue its ailing banks.
3 See EEAG (2013) for more detail.